Web application performance becomes critical as your traffic and DAU (daily active users) grow for your application. In the case of bytesizedpieces.com, the more articles we added, the worse the blog performed, which was not ideal!
Wouldn’t it be nice to know how we can trace with exact certainty why a solution is non-performant, as well as how to go about fixing it in a way that we enhance performance by more than 20% in one go?
We used pagespeed insights to rank our website performance. Another reliable and popular tool is the open-source lighthouse.
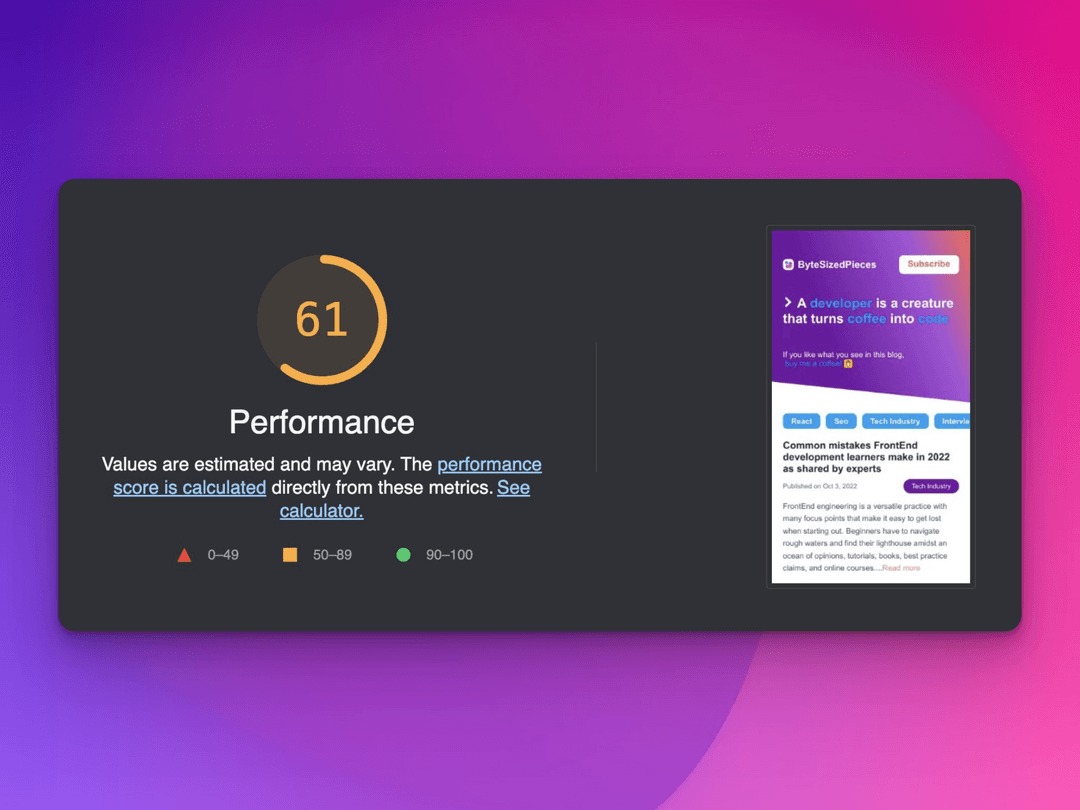
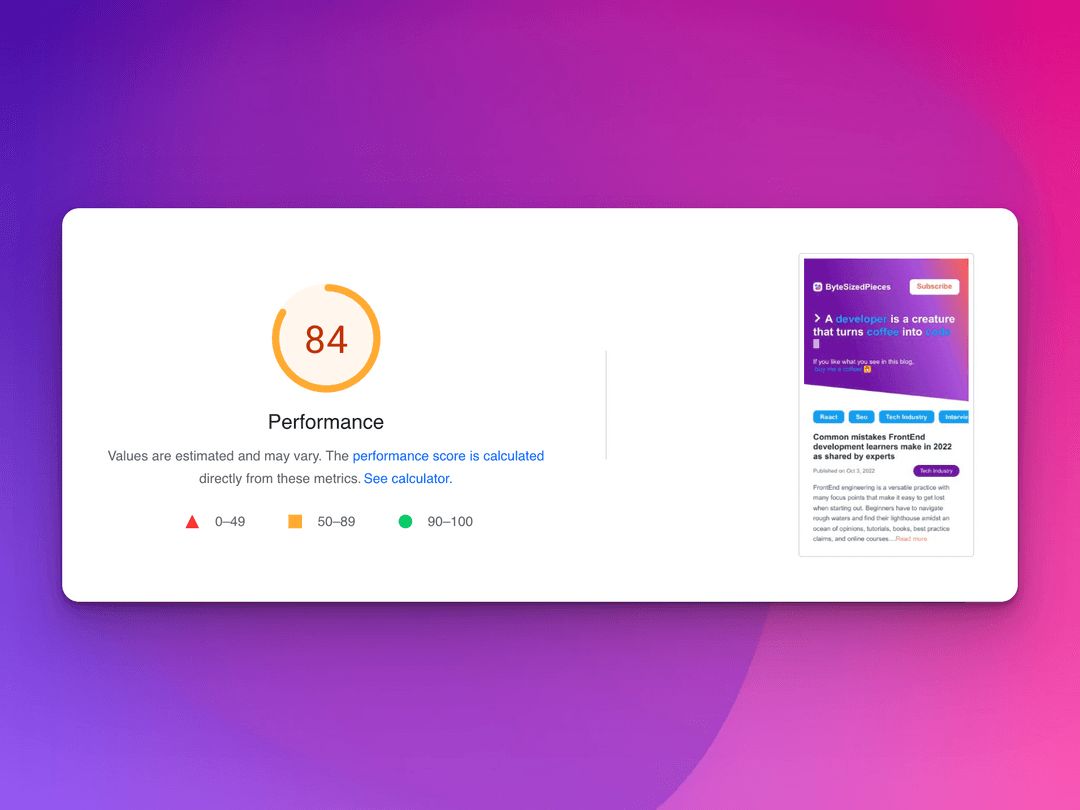
Let’s go over how we achieved more than a 20% increase in application performance improvement for bytesizedpieces.com!
Problem Background
ByteSizedPieces launched with implementation-specific shortcomings we were aware of from the get-go. Sacrifices were made to get a proof-of-concept version of our blog and have it launch faster. If it registered well with users, well, then comes the fun part of improving those pain points!
We recently completed round one of Byte Sized improvements.
In this article we will go over how to:
- Diagnose application performance issues using the Chrome DevTools
- Strategize cost-effective approaches for resolution and further future improvement
- Implement the first round of performance improvement
ByteSizedPieces Performance Degradation over Time
The Google Console Tool has been a stellar monitoring tool for the search traffic and performance of ByteSizedPieces. As more articles were released, it became apparent the performance of the website was degrading. Each article published resulted in a slower page load time, and we knew this would eventually result in poorer impressions and conversions.
ByteSizedPieces was built in such a way as to be cost-effective for as long as possible. Bearing this in mind, we chose not to utilize a CMS or Content Management System like most blogs.
Each article is preserved statically within the ByteSizedPieces repository, under a templates folder, pictured like so.
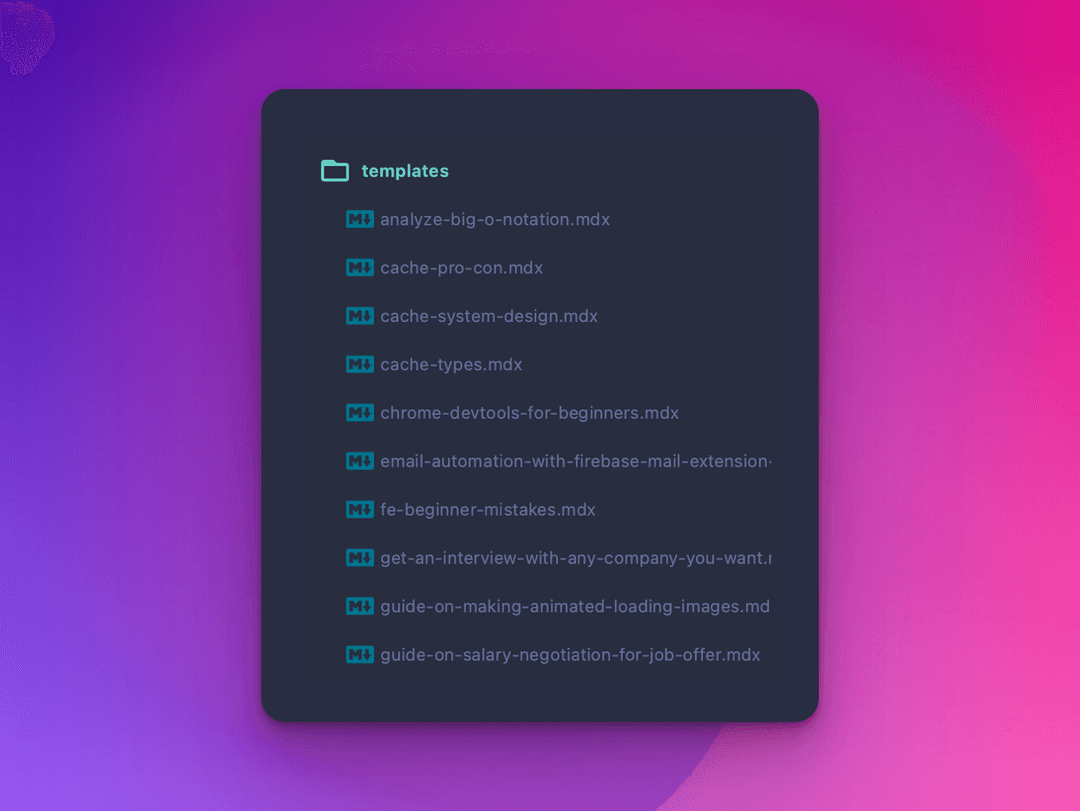
Here is where the problem comes in with the expected growing list of articles. The approach for ByteSizedPieces was to load all of the articles in templates, order them, and serve them to the client. We added an InfinteScroll component that precluded immediate render of all the posts, however, the majority of work has been done already.
If you’re curious to learn more about how the ByteSizedPieces blog setup is written, we have another article on how ByteSizedPieces is currently built which is actively updated and maintained for accuracy.
Now that we have our suspicions about what the source of the problem is, we next need to ascertain whether our suspicion is accurate, before thinking about how we can hash out a solution.
Diagnosing application performance issues with the Chrome DevTools
The Chrome DevTools has a number of effective tools that serve to aid developers in debugging, analyzing their applications, and in our case, diagnosing performance issues.
We suspect that our initial page load is burdened by all the files being pulled in and served to the client. Let’s see how we can prove that this approach is indeed a problem for website performance.
First, we start by visiting the home page, opening the Chrome DevTools, and selecting the performance tab.
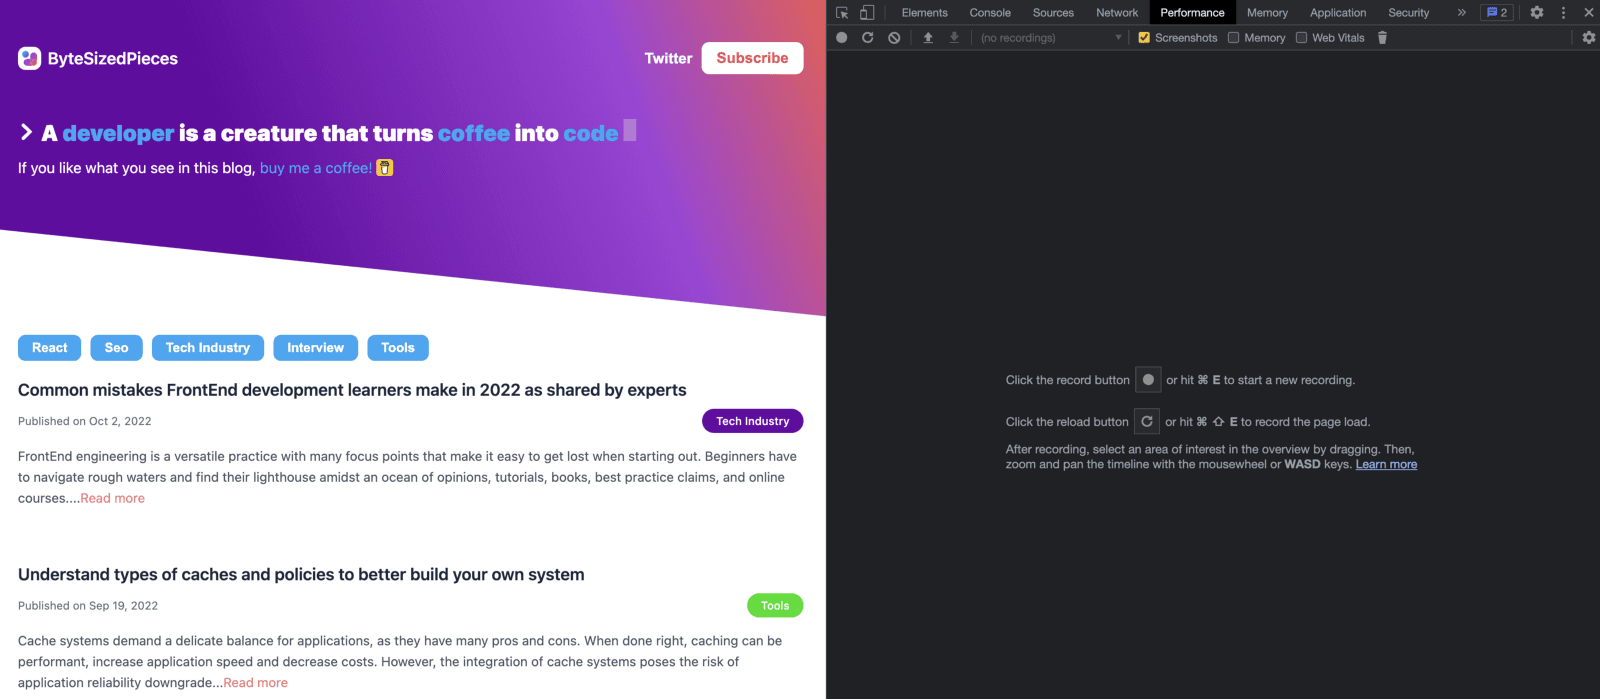
Now we will select the circular arrow next that on hover says “Start profiling and reload page”. Wait for the recording process to complete and for a similar recording to display.
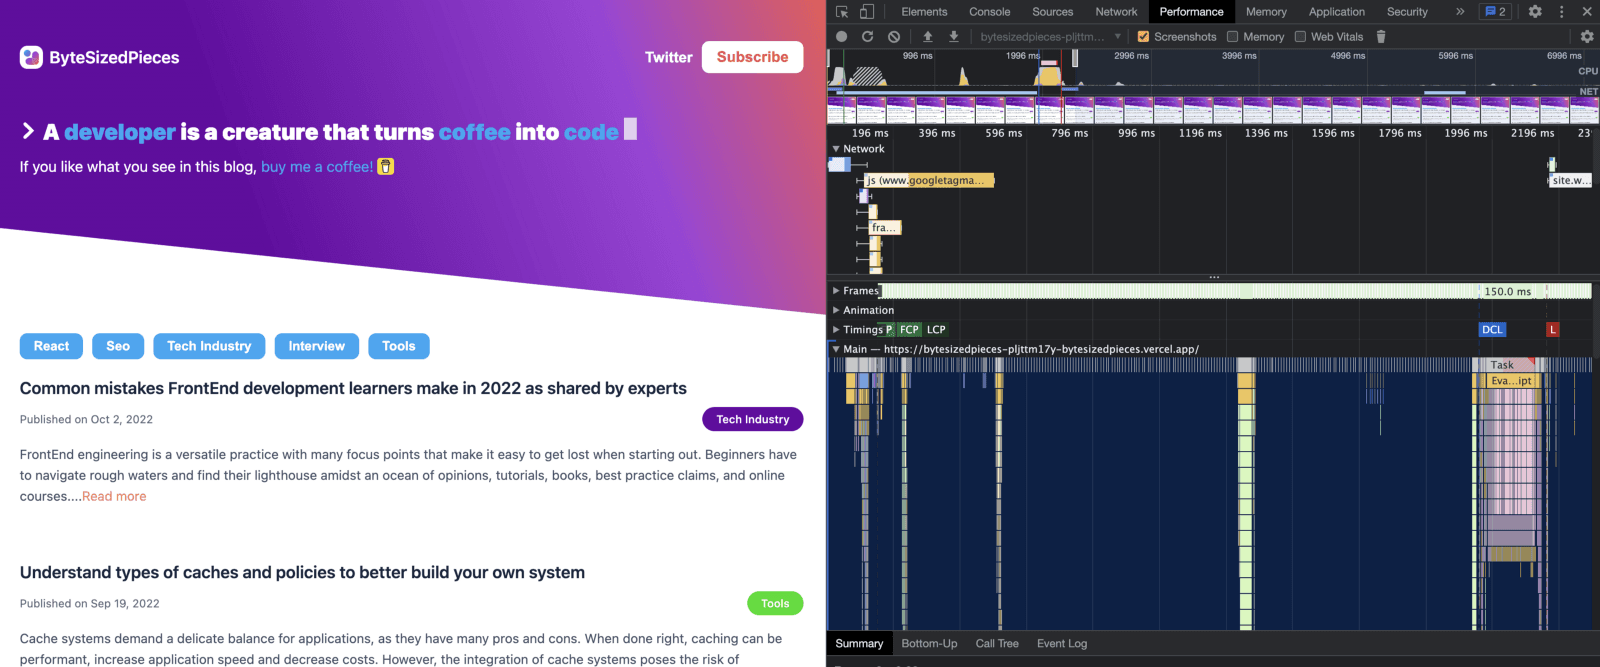
With the performance tab, I typically first look at the Network view. You can zoom in on an area of interest where it seems like the delay is quite large for the network events that occur.
Here I observed a red line indicating a task that took a while. The DevTools allow me to create a window from start to finish so I can closer evaluate what made this task so long.
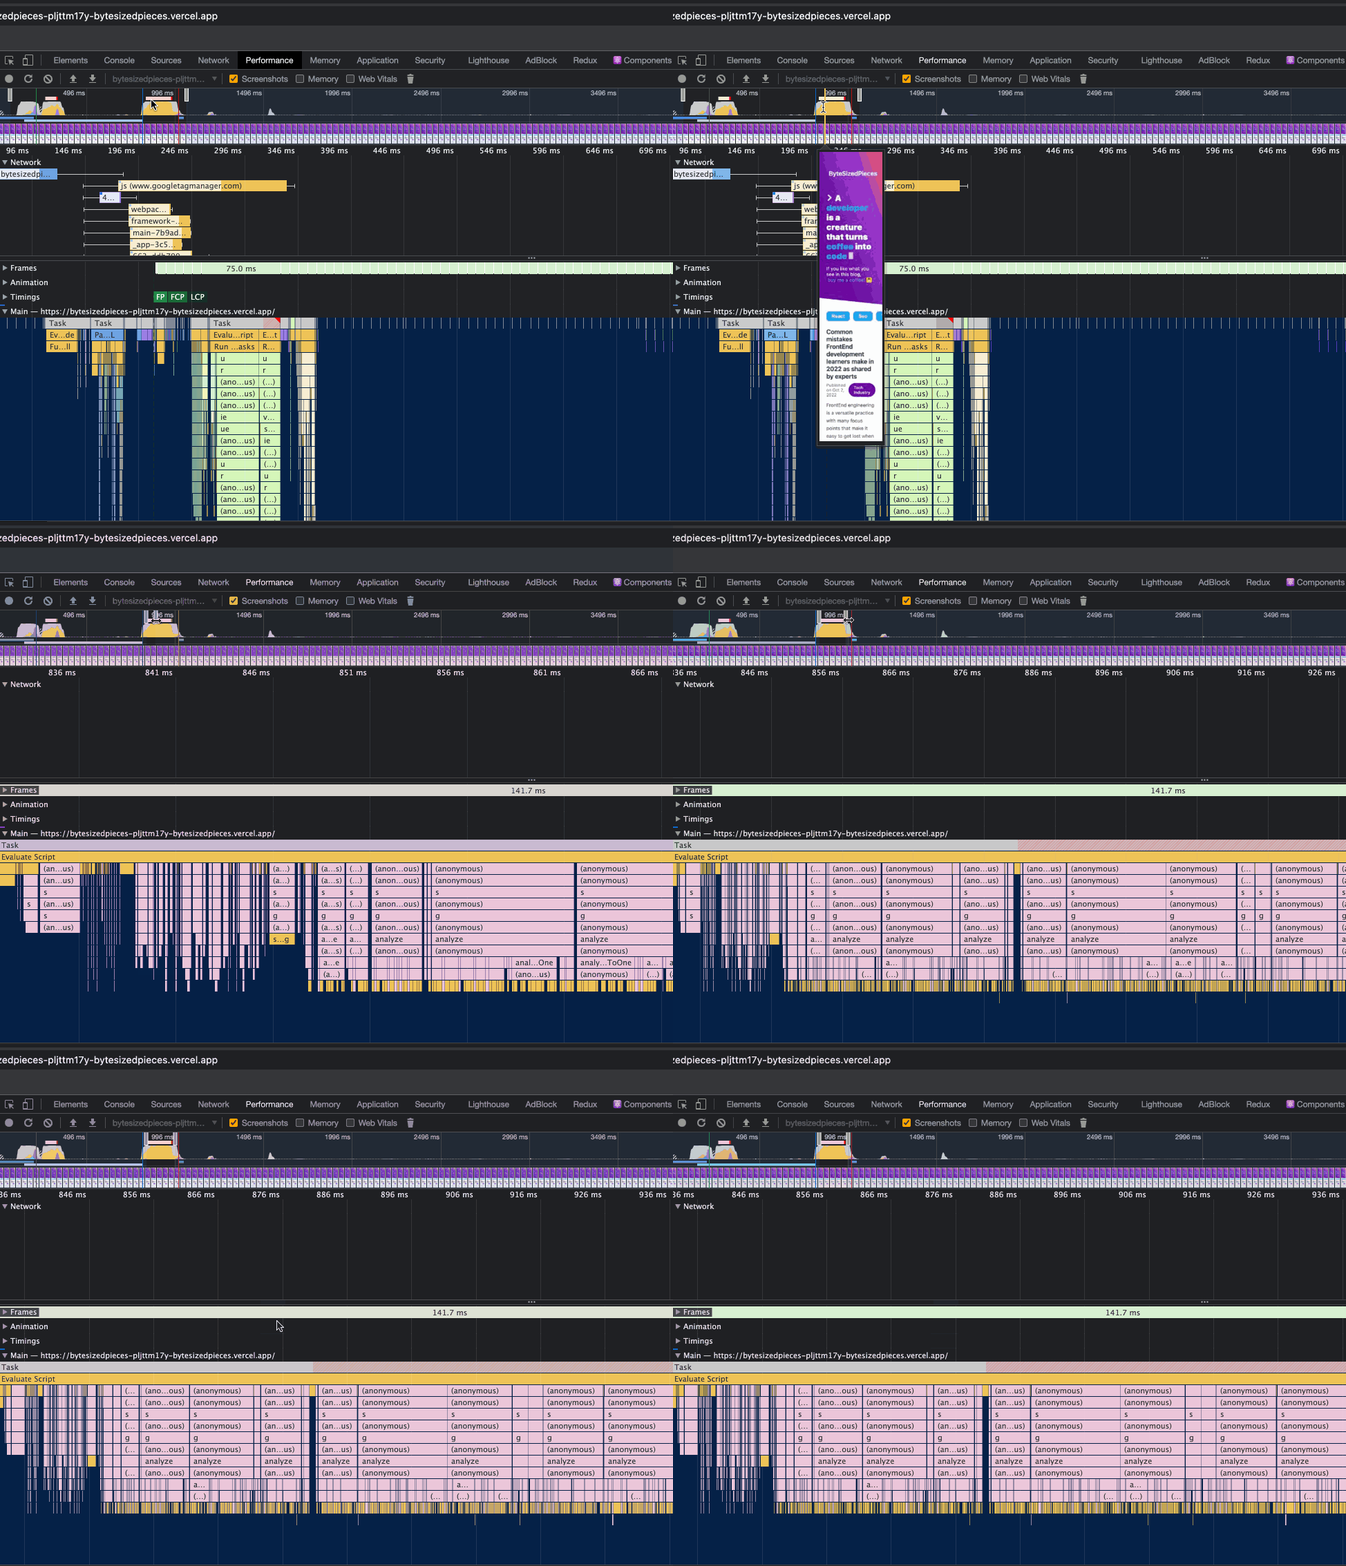
Now that we have observed how to adjust the window pane and discover long tasks, let’s move focus to the beginning of the recording, and see what we find there.
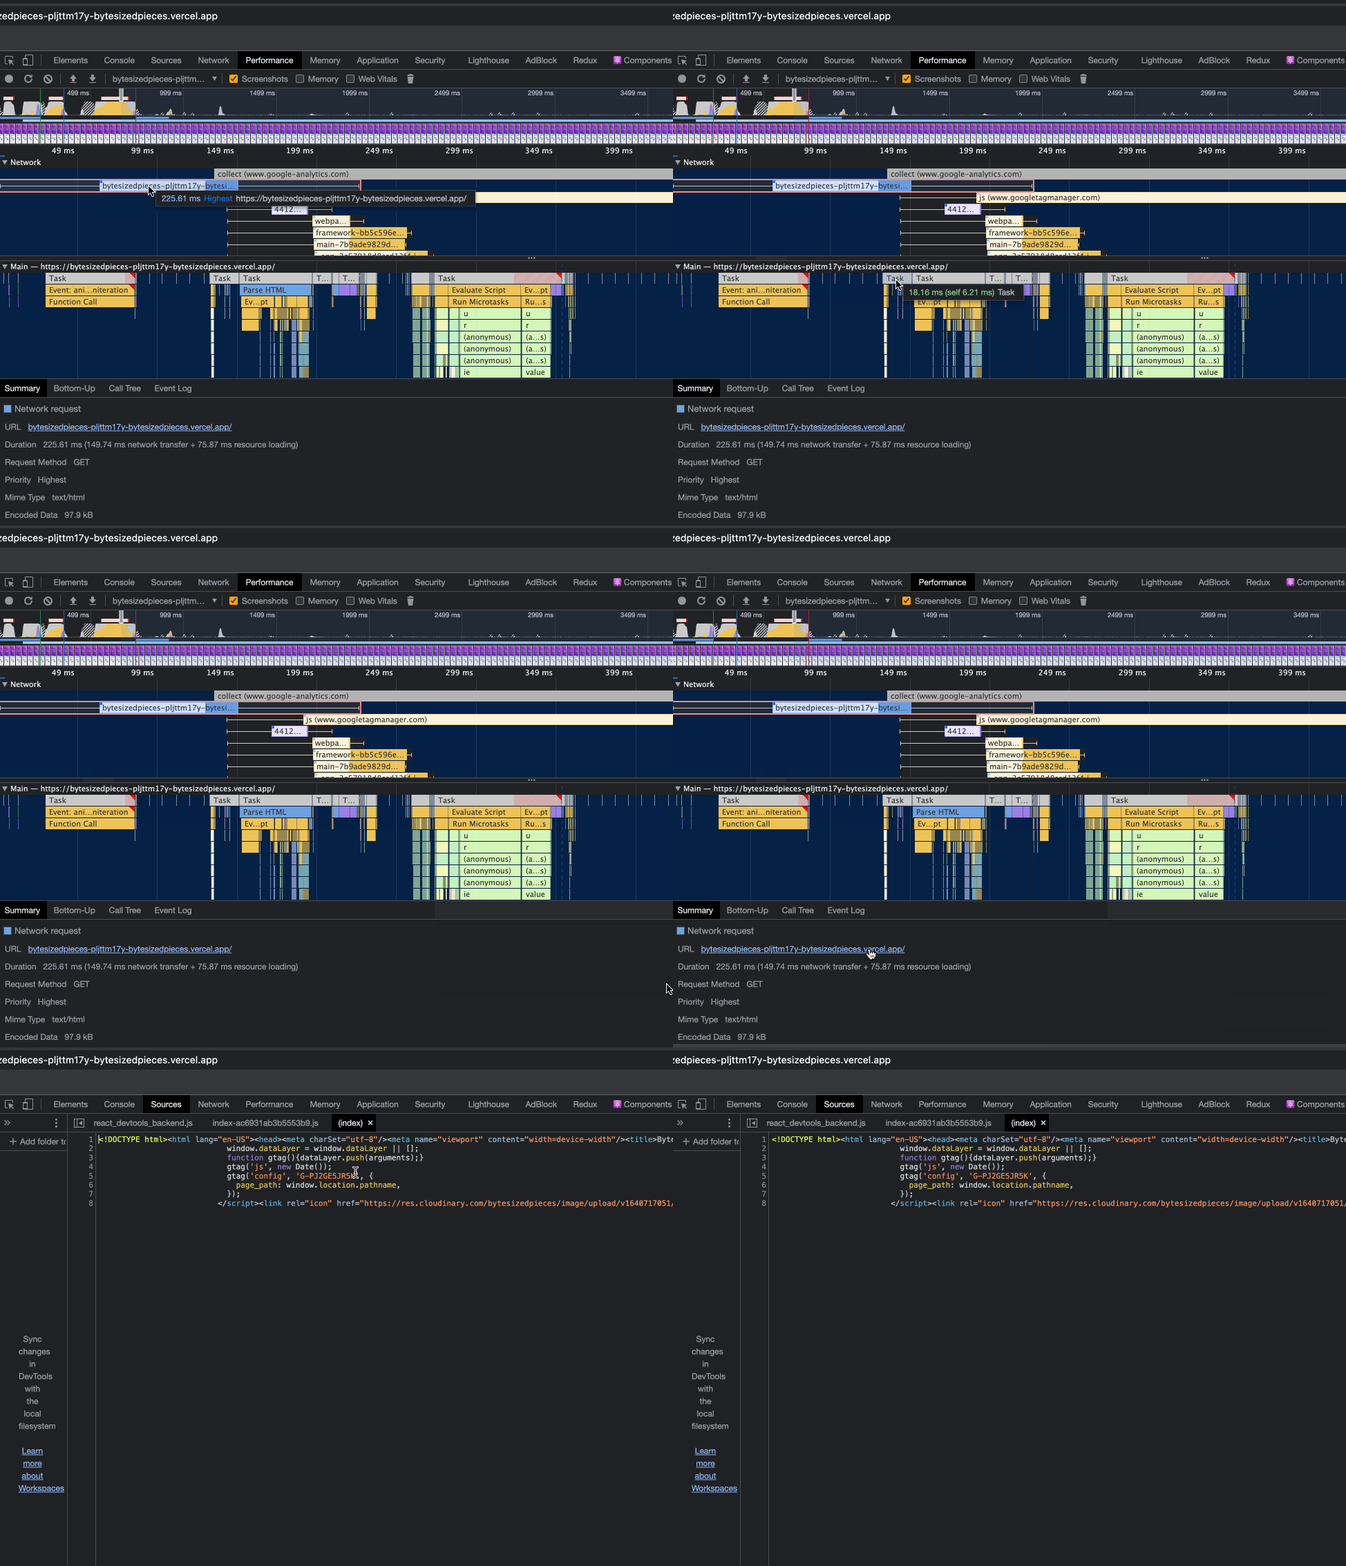
In the above, observe that we have moved the sliding window closer to the beginning of the website performance recording.
In the network section we hone in on a task that seems to be quite long, and within the main thread section has been flagged as a long task. When I select the network request, we actually see that this request is for serving the HTML content.
Next, we refer to the Network tab within the Chrome DevTools and try to find that same network request.
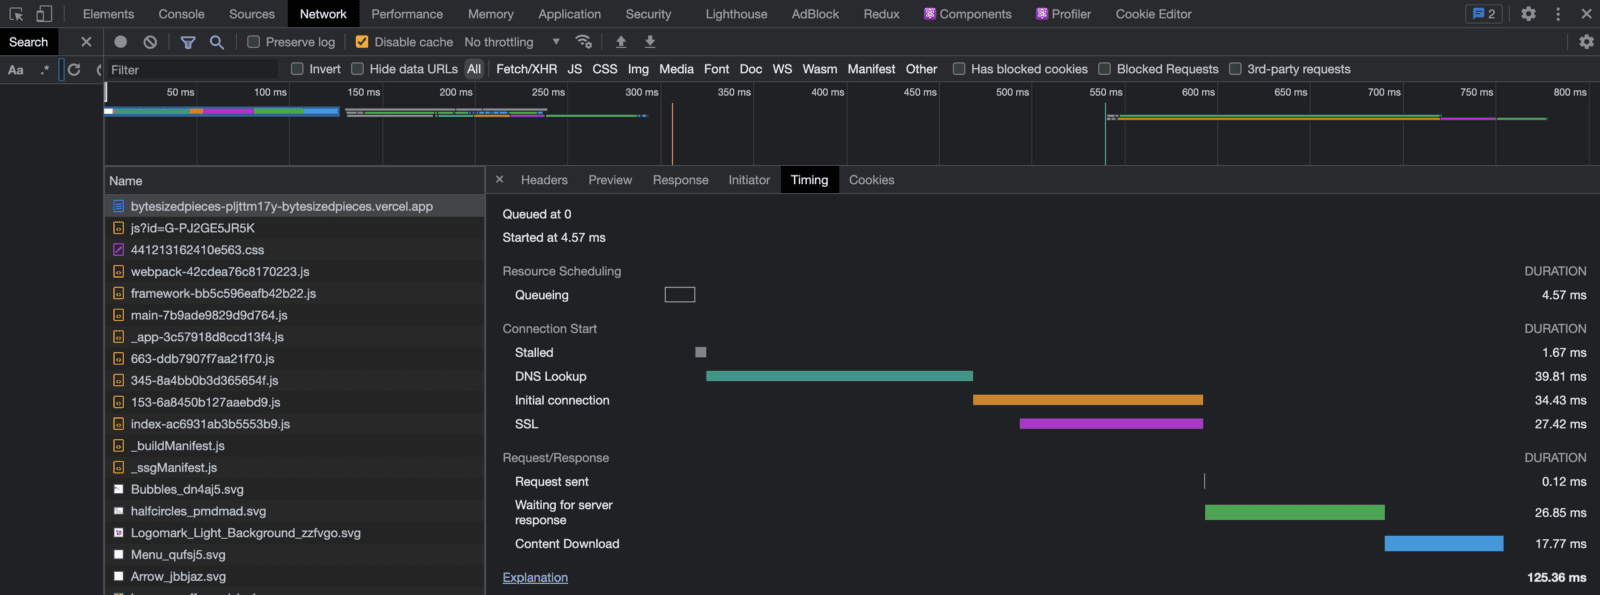
Upon observing a waterfall breaking down the stages for that task, note that the total duration for requesting HTML from the server takes a whopping 125ms!
Of course we are seeing degrading page performance with each new article! That HTML blob is only getting bigger!
Now how do we go about fixing this?
Strategize cost-effective approaches for resolution and further future improvement
We can run a simple experiment to test the difference in timing if we try to retrieve less content on the initial page load.
Let’s attempt fetching only 3 of our articles and see how this impacts the timing.
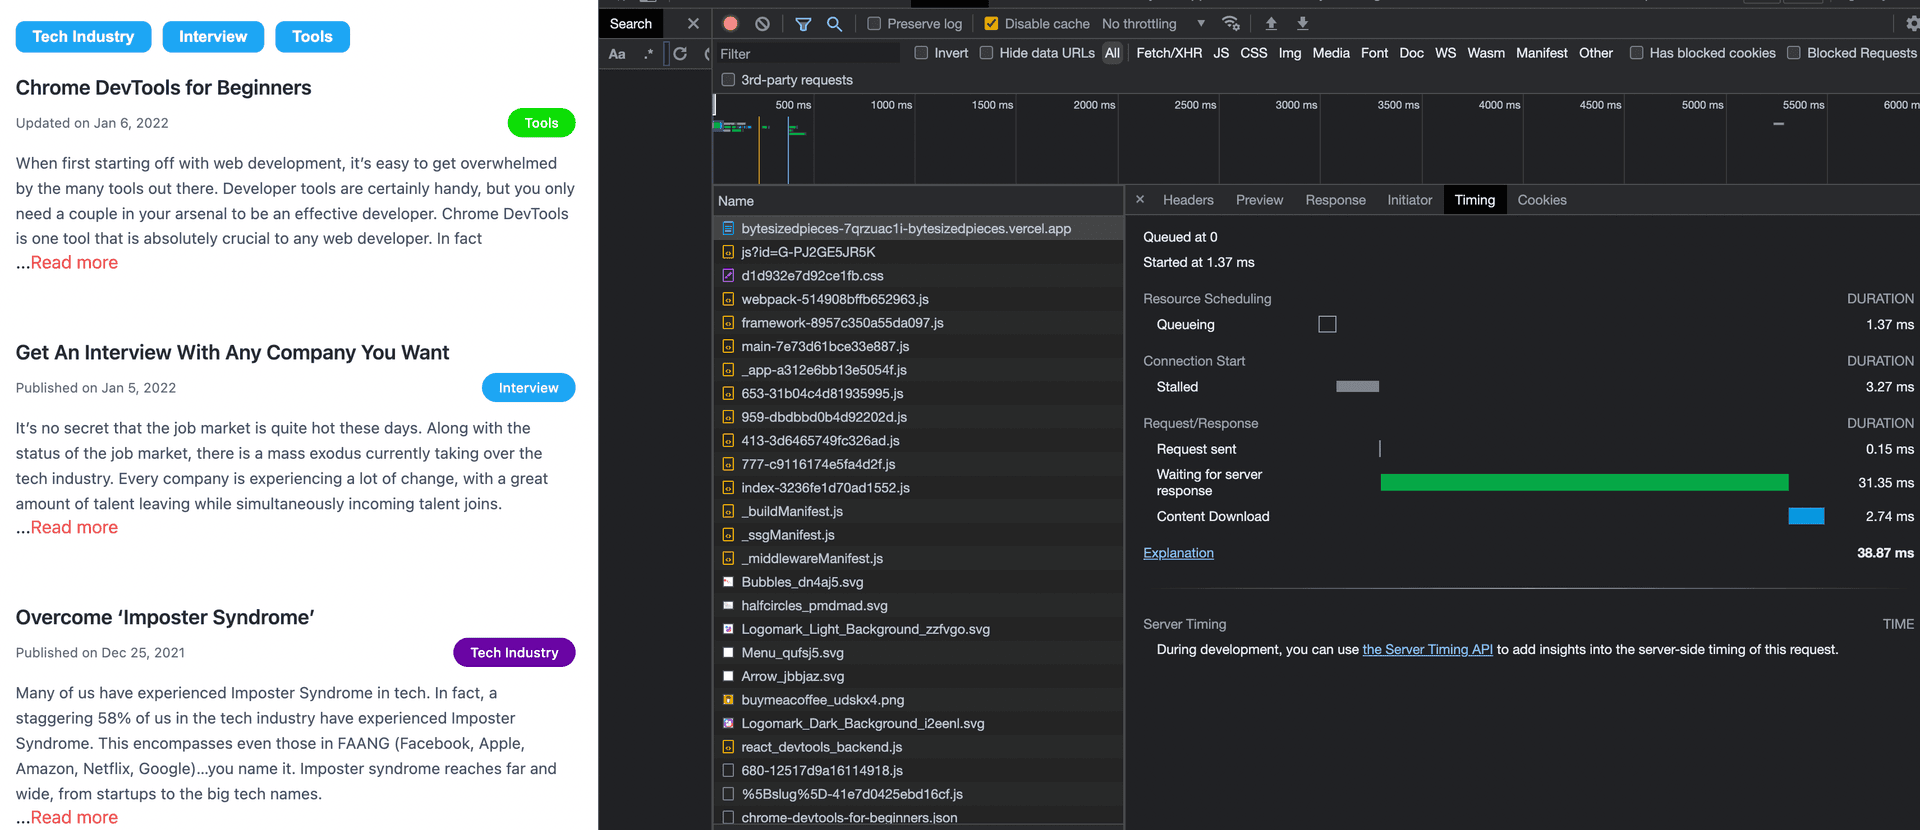
By fetching four articles, we went from 125ms to 38ms. Now we’re talking!
Solution Brainstorming
Going forward, we bear in mind that we ideally want a cost-effective solution, but now that ByteSizedPieces is growing, we need to come up with an effective way to limit the number of articles we retrieve on that initial page load.
Essentially, ByteSizedPieces has grown to the point where it can stand to benefit from introduction of storage.
Here are a few ways we can introduce storage to the web application:
- Database
- CMS (Content Management System)
- Cache
Still bearing in mind the desire for cost effective solutions, we can avoid introducing a database and CMS for a bit longer without sacrificing performance.
Therefore the choice for a solution to our performance improvements falls to add caching to the website! Now all the caching articles ByteSizedPieces has released are making sense!
If you haven’t read about the pros and cons of caching, the system design strategy for caching, and finally the different types of caching policies, best peruse those articles for clarity on the upcoming discussion.
Caching Focused Approaches
When it comes to caching, we were considering two viable options.
- Dedicated server
- set of dedicated servers
- in-system in-memory cache
A dedicated server can scale well but will come with an immediate cost, while an in-memory cache system would technically work and could be upgraded so long as ByteSizedPieces is monitored for cache performance degradation. In conjunction, we would need to be cautious to implement our solution in such a way that it can be easily migrated to a more complex system.
Now, ByteSizedPieces is still not large enough to justify a dedicated server. Therefore we opted for considering an in-memory caching approach for our solution.
Implement performance improvement choice
Let’s observe the areas in the codebase that will be affected by our changes.
First the most obvious will be our Home component. Before we had a getStaticProps setup that would retrieve the files that are our articles, map through the list and format and sort the items.
export function getStaticProps() {const posts = postFilePaths.map((filePath) => {const source = fs.readFileSync(path.join(POSTS_PATH, filePath));const { content, data = {} } = matter(source);return ({content,data,filePath,formattedFilePath: getMDXFileName(filePath)});}).sort((first, second) => new Date(second.data.publishedOn) - new Date(first.data.publishedOn));return {props: {posts}}}
Now instead we need to have a service we can utilize to retrieve an initial set or chunk of blog posts.
We already had an InfiniteScroll component leveraged to defer rendering. Perhaps this could be adjusted to instead query for a new chunk of articles. The idea is to leverage the same service and request the next set of items to render at a scrolling point determined by an Intersection Observer, instead of just rendering the next set of items from the fully retrieved list.
Now finally we need to think about how the service would work.
Ideally, our service maintaining the content should be a singleton, that will retrieve the posts and retain them in a cache instantiated within the service’s constructor.
We can have the cache store two fields.
The first detail our cache will store is a map where the key is the slug name of the post and the value of the formatted post. We would also have the cache store an array that represents the intended order of the posts. In the case of ByteSizedPieces, the order of the posts is determined by the publishing date.
What we want is a helper method that would get a certain chunk of posts. Given a starting index and a chunk size, we would refer to the cache for retrieval of the relevant set of items.
Finally, we can leverage a NodeJS internal cache module to support our in-system caching solution. In our case, we decided to rely on node-cache given its appropriate size, high usage, and maintenance.
Let’s take a look at how this can be implemented.
ContentService Singleton Implementation
// Dependenciesimport NodeCache from 'node-cache';import matter from 'gray-matter';import fs from 'fs';import path from 'path';// Utilsimport { getMDXFileName, getPostFilePaths, POSTS_PATH } from '../utils/mdxUtils';class ContentService {constructor () {this._cache = new NodeCache();const posts = getPostFilePaths().map((filePath) => {const source = fs.readFileSync(path.join(POSTS_PATH, filePath));const { content, data = {} } = matter(source);return ({content,data,filePath,formattedFilePath: getMDXFileName(filePath)});}).sort((first, second) => new Date(second.data.publishedOn) - new Date(first.data.publishedOn));// need to set by order of datethis._cache.set('slugOrder', posts.map(({ formattedFilePath }) => formattedFilePath));this._cache.set('postsBySlug', posts.reduce((acc, post) => {acc[post.formattedFilePath] = post;return acc;}, {}));}getContentBySlug = (slug) => {const postsBySlug = this._cache.get('postsBySlug') || {};return postsBySlug[slug];}getContentByPage = (page, itemsPerPage) => {const slugOrder = this._cache.get('slugOrder') || [];const startIndex = page * itemsPerPage;if (page < 0 || startIndex >= slugOrder.length) {return [];}return this._getContentByIndeces(startIndex, startIndex + itemsPerPage);}_getContentByIndeces = (startIndex, endIndex) => {const slugOrder = this._cache.get('slugOrder') || [];return slugOrder.slice(startIndex, endIndex).map((slug) => this.getContentBySlug(slug));}}export default new ContentService();
Now that we have the ContentService singleton, we need to make the correct adjustments to the relevant routes to take advantage of the caching solution.
First, we needed to update our Home component to utilize the new service within getStaticProps. This change is simple enough thankfully.
export function getStaticProps() {const posts = ContentServiceSingleton.getContentByPage(0, ITEMS_CHUNK) || [];return {props: {posts}}}
With these changes, we now see only the ITEMS_CHUNK quantity of articles rendered on the Home page. When we scroll, however, we do not yet see the expected behavior with the next set of items rendering.
We should now add the support necessary for the InfiniteScroll component to retrieve the next chunk of items which triggers a state change to re-render with the next set of posts.
What we need to consider, however, is how we will achieve this with our ContentService given this logic will execute on the client. Our ContentService won’t play nicely on the client given it utilizes fs to read the files, which is a server-side only module.
Our solution is to create an endpoint using NextJS API Routes which are AWS Lambda provisioned serverless functions. The endpoint enables us to utilize our ContentService.
Here is what a simplified version of that endpoint looks like.
export default async (req = {}, res = {}) => {const { page, nextPage } = req.body;try {const items = ContentServiceSingleton.getContentByPage(page, ITEMS_CHUNK);res.status(200).send({items,nextPage: items.length === ITEMS_CHUNK ? nextPage + 1 : nextPage});} catch (e) {} // Error handling};
Now we add a handler in our Home page that will use this endpoint like so:
getNextPage = async () => {const { page, nextPage: oldNextPage, posts: oldPosts = [] } = this.state;const res = await fetch('/api/getContentByPage', {body: JSON.stringify({page,nextPage: oldNextPage}),headers: { 'Content-Type': 'application/json' },method: 'POST'});let posts = [];if (res.ok) {const { items = [], nextPage } = await res.json();this.setState({page: oldNextPage,posts: [...oldPosts,...items],nextPage});}}
Our InfiniteScroll component will consume this method as a prop, and invoke it when the Intersection Observer notices the user has scrolled to expose a bottommost element that we have chosen to reference.
Home or the parent of InfiniteScroll will maintain the state of the posts. The state gets updated when InfiniteScroll invokes the handler with the job of calling our endpoint to retrieve the next chunk of items. We arrive full circle, and now when we scroll to the bottom, we observe the next set of items indeed display!
However, our job is not completely done. We notice some jumpy behavior from the scroll that is jarring for the eye.
Our solution for this is to ease in the newly rendered posts. How better to accomplish this than with a keyframes animation that gradually adjusts opacity from 0 to 1?
ByteSizedPieces uses ThemeUI for styling, therefore we followed the documentation set for ThemeUI-based keyframe and we are home free!
We open our handy Chrome DevTools one more time with the Network tab selected. We add a filter to focus exclusively on Fetch/XHR given we are interested in the API queries to populate the new post.
Let’s test our solution!
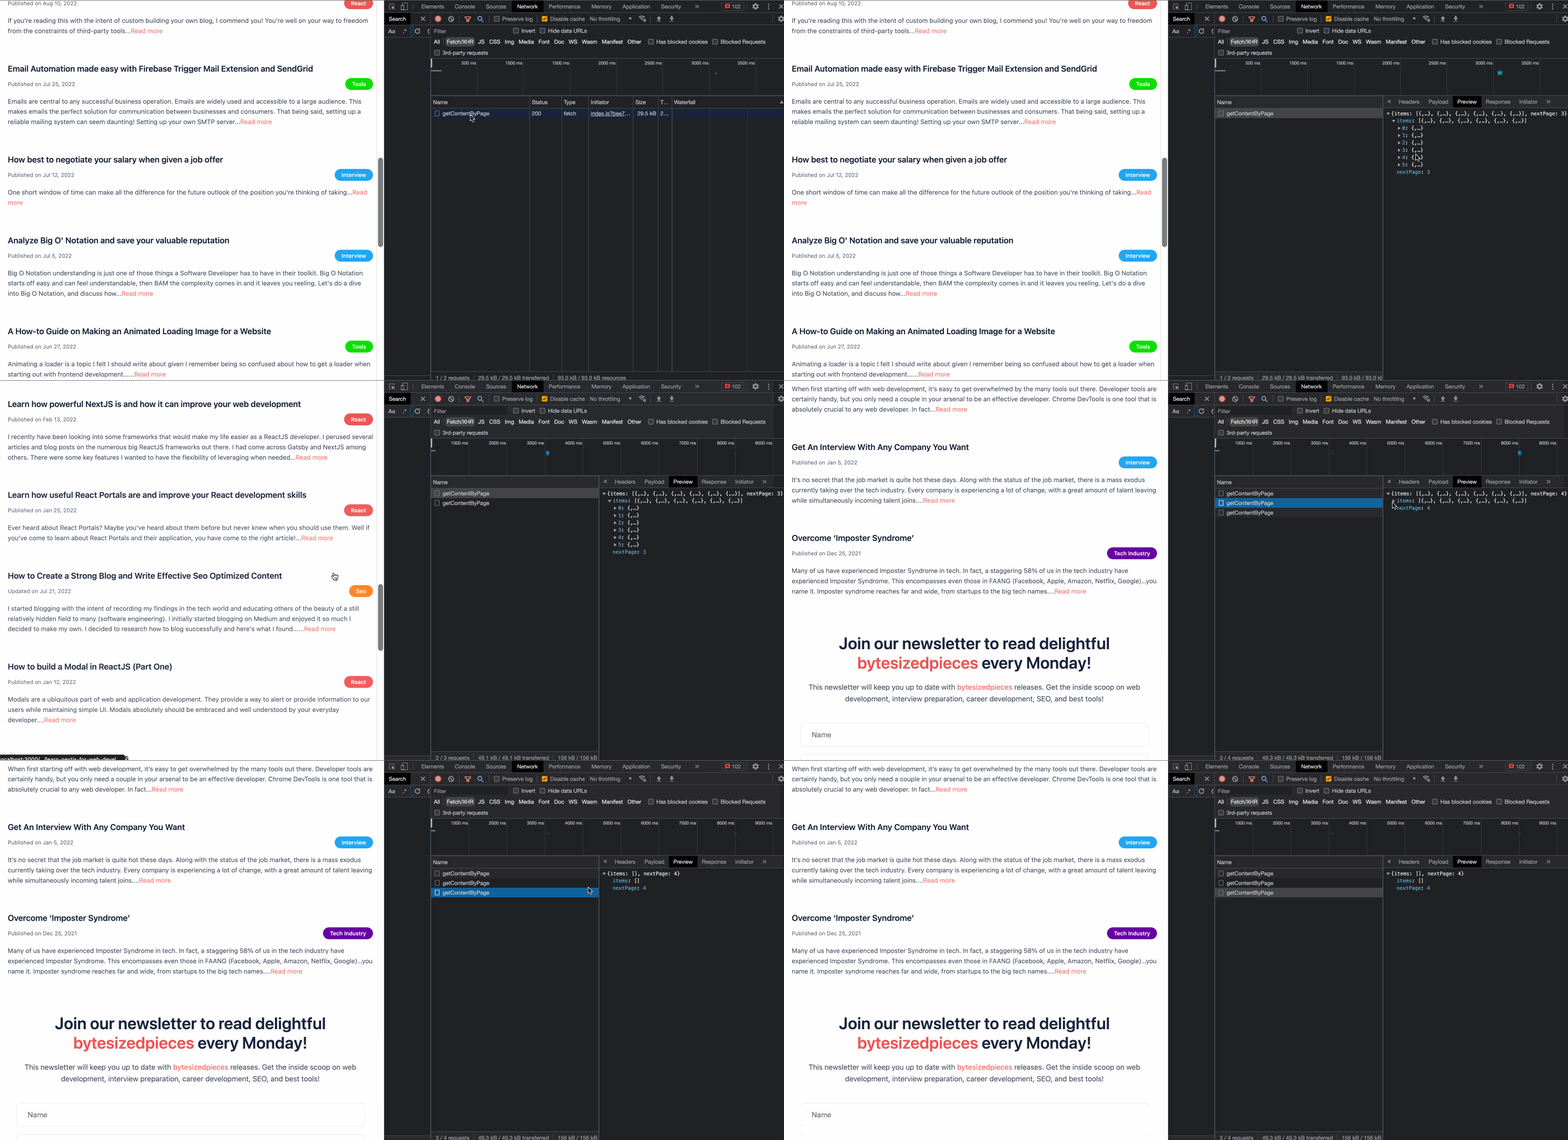
Beautiful!
We see our posts rendering seamlessly. The last bit is to check if we have successfully improved the performance of ByteSizedPieces. After all, the performance improvement was the point of this effort!

Adding an in-system in-memory cache storing our blog posts and fetching new chunks via our InfiniteScroll component resulted in a 23% performance improvement!
Of course, our solution is still not perfect. ByteSizedPieces has several more improvements that can be made to boost this number even more. But we are delighted with these results.
Remember, developers are creatures that turn coffee into code. So I'd very much appreciate if you bought me a coffee!  I’m a new writer and I will be posting very frequently on my findings and learnings in the tech industry and beyond. Join my newsletter if you would like to stay tuned!
Thanks for reading again! ❤️
| Understand Open Graph Dynamic Image Meta Tags | 1 |
| Pros and Cons of Caching Data in Software | 2 |
| How to build a Modal in ReactJS (Part One) | 3 |
